Dashboard
The Dashboard is the home page of each project. It shows at a glance the state of the construction site and what needs your attention, without going through the tasks.
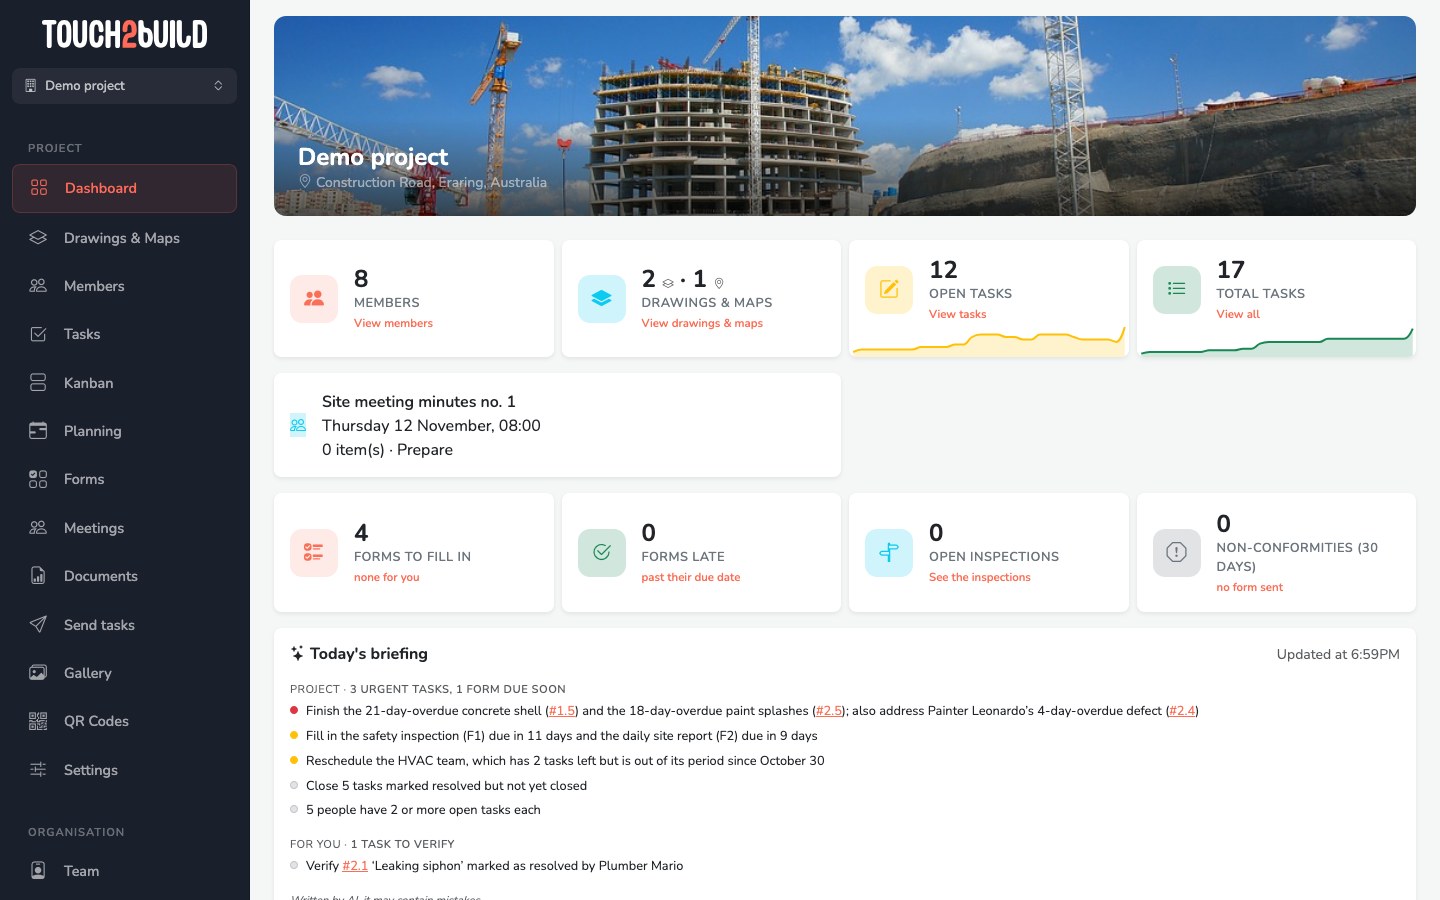
Key figures
Four cards sum up the project: number of Members, of Drawings & Maps, of Open Tasks and Total Tasks. The small curves show the recent trend. Click the link of a card to open the matching section.
Today's briefing
Today's briefing is a summary written automatically by artificial intelligence. It has two parts:
- Project: what needs attention on the site, for example late tasks or trades running behind on the planning;
- For you: what you have to do yourself, such as resolved tasks to check and close.
The colour of the badge shows the urgency: red for urgent, yellow for keep an eye on, grey for information. Click a task number to open it.
Warning
Today's briefing is written by AI and may contain mistakes. Check before you act.
Today's briefing is included in the Pro plan. During the trial, artificial intelligence is limited to 100 requests per month. See Compare the offers.
Notifications
The Notifications block lists the latest events of the project: status changes, comments… Click the cross to dismiss a notification, or Mark all as seen.
Charts
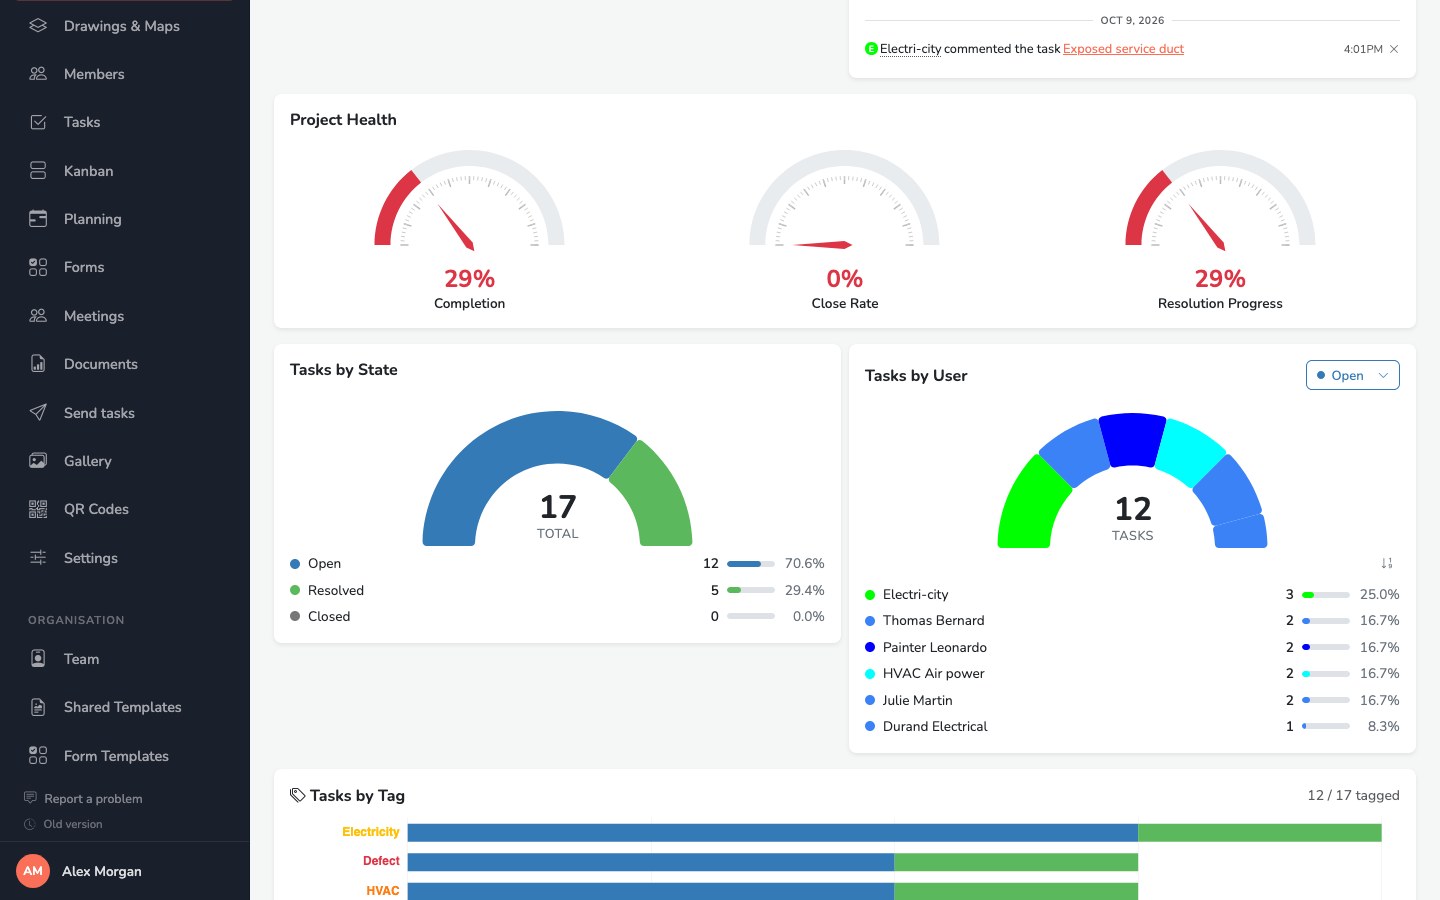
- Project Health
- Three gauges. Completion: share of tasks that are resolved or closed. Close Rate: share of tasks that are closed. Resolution Progress: share of resolved tasks among open and resolved tasks.
- Tasks by State, by User, by Tag
- The spread of the tasks, to spot an overloaded company or a trade running late.
- Task History
- The change in the number of tasks over time.